(RM’thousand) | 9 Months Sept-24 FY2024(Unaudited) | 12 Months Dec-23 FY2023 | 12 Months Dec-22 FY2022 | 12 Months Dec-21 FY2021 | 12 Months Dec-20 FY2020 | 12 Months Dec-19 FY2019 | 6 Months Dec-18 FP2018 | 12 Months Jun-18 FY2018 | |
---|---|---|---|---|---|---|---|---|---|
FINANCIAL RESULTS | |||||||||
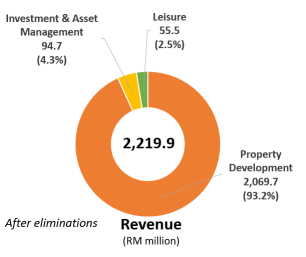
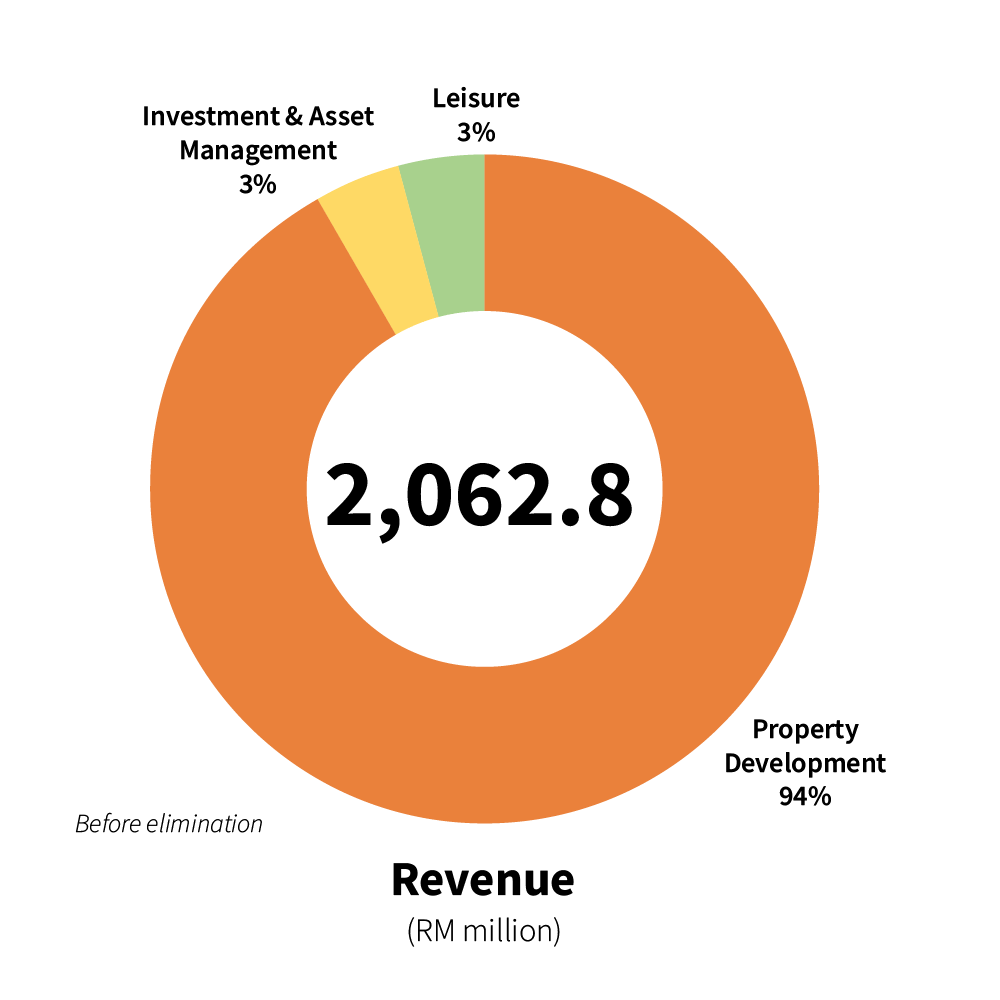
Revenue | 3,273,751 | 3,436,947 | 2,742,136 | 2,216,557 | 2,062,781 | 3,179,994 | 1,269,145 | 2,353,104 | |
Profit/(Loss) before interest and taxation | 603,400 | 570,312 | 450,237 | 272,719 | (480,404) | 567,339 | (51,823) | 682,516 | |
Profit/(Loss) before taxation (PBT) | 636,766 | 610,306 | 458,860 | 280,495 | (474,804) | 665,670 | (38,146) | 728,382 | |
Profit/(Loss) after taxation | 425,608 | 417,530 | 311,698 | 162,298 | (535,547) | 590,881 | (311,179) | 684,286 | |
Non-controlling interests | 11,812 | 9,616 | (4,141) | 15,405 | (33,981) | (7,650) | 7,521 | 44,278 | |
Profit/(Loss) attributable to owners of the Company (PATAMI) | 413,796 | 407,914 | 315,839 | 146,893 | (501,566) | 598,531 | (318,700) | 640,008 | |
FINANCIAL POSITION | |||||||||
Share capital | 6,800,839 | 6,800,839 | 6,800,839 | 6,800,839 | 6,800,839 | 6,800,839 | 6,800,839 | 6,800,839 | |
Share premium and contribution from immediate holding company | - | - | - | - | - | - | - | ||
Reserves | 3,298,986 | 3,256,257 | 2,718,879 | 2,611,553 | 2,213,005 | 2,920,871 | 2,408,680 | 2,933,748 | |
Shareholders’ Funds | 10,099,825 | 10,057,096 | 9,519,718 | 9,412,392 | 9,013,844 | 9,721,710 | 9,209,519 | 9,734,587 | |
Non-controlling interests | 229,952 | 226,416 | 125,078 | 141,576 | 179,529 | 228,296 | 236,881 | 230,837 | |
TOTAL EQUITY | 10,329,777 | 10,283,512 | 9,644,796 | 9,553,968 | 9,193,373 | 9,950,006 | 9,446,400 | 9,965,424 | |
Property, plant and equipment | 572,801 | 593,345 | 586,343 | 615,247 | 626,178 | 636,284 | 640,445 | 735,159 | |
Investment properties | 1,541,426 | 1,201,105 | 1,085,200 | 987,286 | 709,030 | 745,785 | 644,206 | 605,961 | |
Inventories | 6,564,011 | 6,494,975 | 5,543,837 | 5,792,317 | 6,234,325 | 6,532,772 | 6,752,621 | 6,779,463 | |
Joint ventures | 2,731,344 | 3,135,789 | 2,885,238 | 3,300,352 | 2,476,101 | 2,805,001 | 2,574,020 | 2,223,949 | |
Other non-current assets | 1,923,815 | 1,956,687 | 2,107,517 | 2,158,874 | 2,155,066 | 2,150,586 | 2,187,493 | 2,130,691 | |
Cash (including cash in Housing Development Accounts) | 790,720 | 602,581 | 985,317 | 909,664 | 801,837 | 743,338 | 649,090 | 749,395 | |
Other current assets | 1,994,941 | 1,886,992 | 2,069,257 | 1,858,171 | 1,786,429 | 1,868,527 | 1,588,963 | 1,525,360 | |
Assets held for sale |
| 68,850 | - | - | - | - | 79,519 | - | |
Total Assets | 16,119,058 | 15,940,324 | 15,262,709 | 15,621,911 | 14,788,966 | 15,482,293 | 15,116,357 | 14,749,978 | |
Total debts | 2,806,064 | 2,939,456 | 3,083,441 | 3,898,348 | 3,409,406 | 3,295,999 | 3,273,037 | 2,542,352 | |
Non-current liabilities (excl. total debts) | 797,947 | 817,573 | 794,513 | 783,559 | 627,871 | 596,043 | 513,173 | 516,911 | |
Current liabilities (excl. total debts) | 2,185,270 | 1,899,783 | 1,739,959 | 1,386,036 | 1,558,316 | 1,640,245 | 1,883,747 | 1,725,291 | |
Liabilities associated with assets held for sale | - | - | - | - | - | - | - | - | |
Total Liabilities | 5,789,281 | 5,656,812 | 5,617,913 | 6,067,943 | 5,595,593 | 5,532,287 | 5,669,957 | 4,784,554 | |
NET ASSETS | 10,329,777 | 10,283,512 | 9,644,796 | 9,553,968 | 9,193,373 | 9,950,006 | 9,446,400 | 9,965,424 | |
FINANCIAL RATIOS (%) | |||||||||
PBT margin | 19.5 | 17.8 | 16.7 | 12.7 | (23.0) | 20.9 | (3.0) | 31.0 | |
PATAMI margin | 12.6 | 11.9 | 11.5 | 6.6 | (24.3) | 18.8 | (25.1) | 27.2 | |
Return on average shareholders’ funds | 5.5 | 4.2 | 3.3 | 1.6 | (5.4) | 6.3 | (6.7) | 8.0 | |
Gross gearing ratio | 27.2 | 28.6 | 32.0 | 40.8 | 37.1 | 33.1 | 34.6 | 25.5 | |
Net gearing ratio | 19.5 | 22.7 | 21.8 | 31.3 | 28.4 | 25.7 | 27.8 | 18.0 | |
SHARE INFORMATION | |||||||||
Basic earnings/(loss) per share (sen) | 6.1 | 6.0 | 4.6 | 2.2 | (7.4) | 8.8 | (4.7) | 11.1 | |
Dividend per share (sen) | 1.5 | 2.5 | 2.0 | 1.0 | 1.0 | 3.0 | 1.0 | 5.0 | |
Net assets per share attributable to owners of the Company (RM) | 1.5 | 1.48 | 1.40 | 1.38 | 1.33 | 1.43 | 1.35 | 1.43 |
Notes
1. The Group was listed on Bursa Malaysia on 30 November 2017
2. FY2020 restatement arises from the adoption of the Agenda Decision on the International Accounting Standard 23 Borrowing Costs effective 1 January 2021
3. FY2021 restatement arises from the change in the accounting policy for Investment Properties (“IP”) from cost model to fair value model
4. Return on average shareholders’ funds for FP2018 & H1FY2024 are annualised
Log in using your email address that was registered for